With the continued gradual improvement in schedule reliability in August 2022 and the resultant improvement in vessel delays, the global fleet that was unavailable due to these delays dropped to 7.9%. This was from a peak of 13.8% in January 2022. Keeping in mind the baseline unavailable capacity of 2% (as there are always some delays), at the height of delays in January 2022, an additional 11.8% of capacity was being absorbed. Since that level is down to 5.9% additional capacity in August 2022, this essentially means that the congestion issues have been cut in half, compared to the situation in January 2022.
The significant injection of released capacity has led to a situation, where the physical shortage of capacity, which drove the freight rates up, is no longer an issue in most trades. The question is then, how long will it take for this gradual improvement to get to a point, where the market is fully back to normal? There are multiple different way to look at this.
The first way is to look at the pace of worsening in 2020-2021, and the pace of improvement in 2022. The rate of change for both is quite similar, which means that, using this methodology, a full reversal to normality should come in March 2023. The second way is to compare the current rate of improvement, with the improvement after the congestion problems in 2015. While the rate of improvement in 2022 is faster, it is also starting from a higher level, putting a recovery also by March 2023.
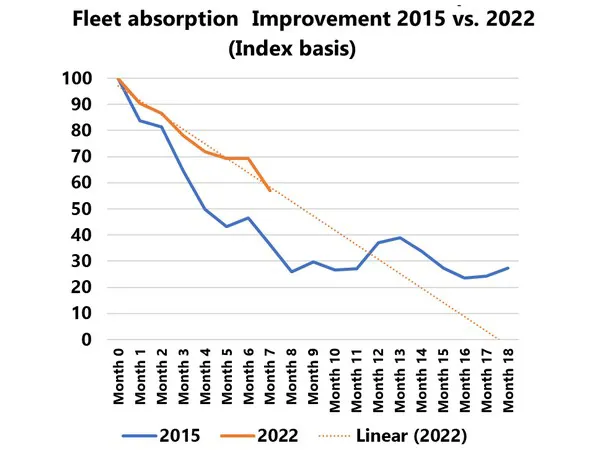
The third way, as shown in the figure above, is to normalize the developments in 2015 and 2022 down to the same baseline and create an absorption index equalling 100 points at the respective peaks. In this case, we can see that in relative terms, the pace of improvement in 2022 is less than in 2015, but the indication is also that the current situation will come down to meet the 2015 developments by January 2023. In summary, all three models suggest we should be back at the “normal” 2% capacity loss baseline by early 2023, assuming the current pace continues, and there any no new major supply chain disruptions.
For more information: sea-intelligence.com